Futuristic KPI Dashboard Slide — Neon Data Visualization Prompt
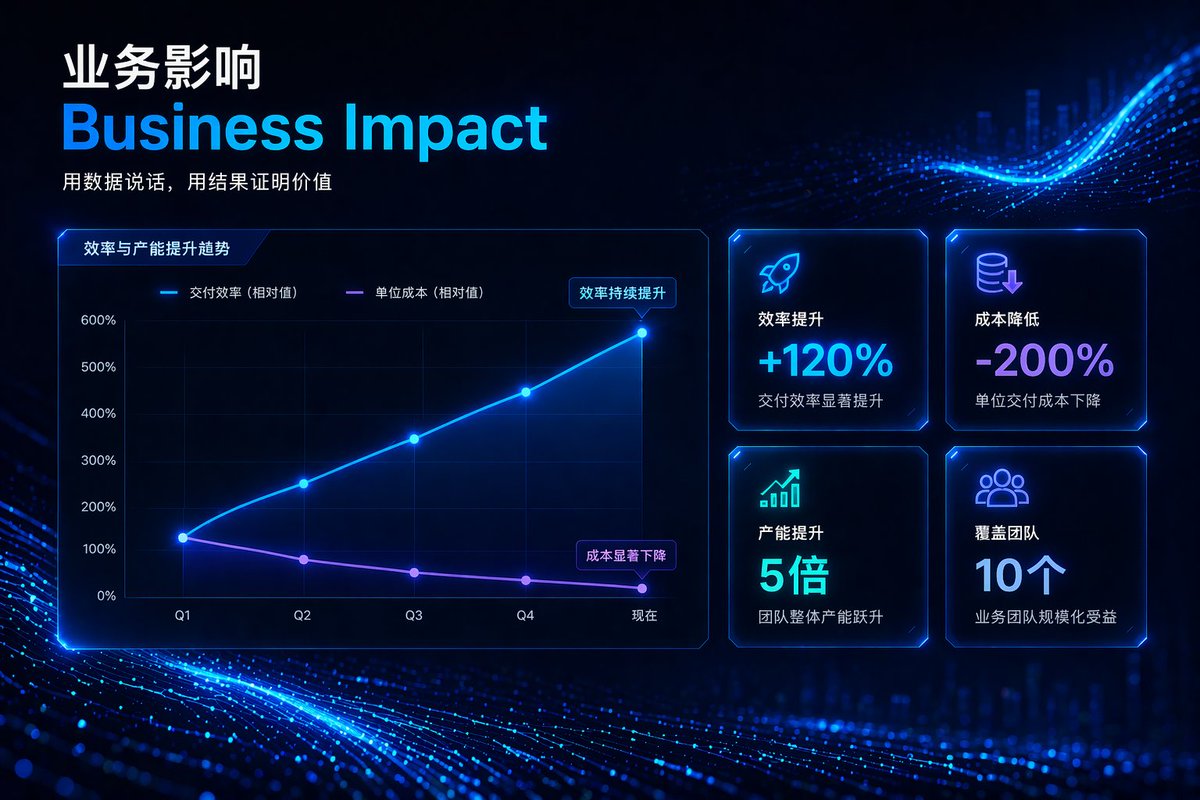
Generate a sleek, dark-mode corporate slide with glowing charts and KPI cards for impactful business presentations.
프롬프트 소개
Generate a sleek, dark-mode corporate slide with glowing charts and KPI cards for impactful business presentations. Use it as a 컨셉 아트 starting point for GPT Image 2: keep the visual structure and style constraints intact, then swap in your own subject, brand, or scene.
This prompt is organized as structured JSON with fields such as type, theme, header, and layout. Keeping that hierarchy helps the model separate the subject, layout, interface elements, and detail constraints.
Start with small changes to subject, scene, camera, and color, then generate a few variations to compare composition and detail without turning the page copy into keyword stuffing.
이 프롬프트 사용법
- Copy the entire prompt JSON.
- Choose an AI image generator that supports structured prompts (e.g., Midjourney, DALL-E 3).
- Tweak the
{argument}variables (e.g., main title, KPI values) to match your specific data. - Submit the prompt to generate your slide.
- Use the output directly or as a base for further editing.