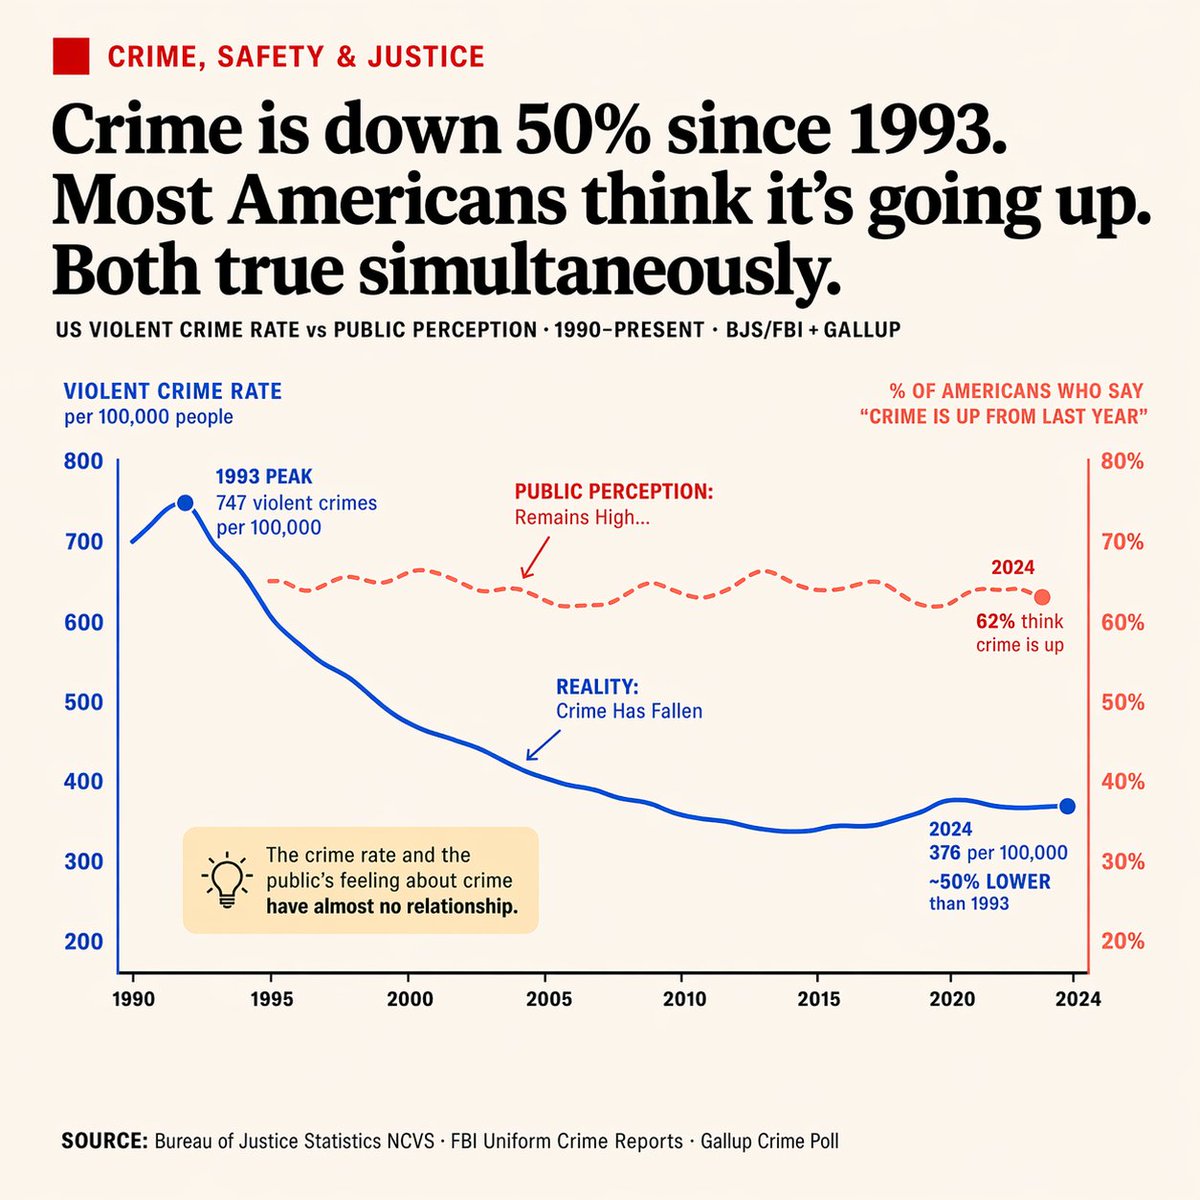
Dual-Axis Line Chart: Crime Rate vs Perception — Sora 2 Prompt
Generate a clean newspaper-style dual-axis line chart with annotations and callout box, perfect for contrasting diverging data trends like crime rates and public perception.
Sobre este prompt
Generate a clean newspaper-style dual-axis line chart with annotations and callout box, perfect for contrasting diverging data trends like crime rates and public perception. Use it as a Arte Conceitual starting point for GPT Image 2: keep the visual structure and style constraints intact, then swap in your own subject, brand, or scene.
This prompt is organized as structured JSON with fields such as type, style, header, chart, callout box, and footer. Keeping that hierarchy helps the model separate the subject, layout, interface elements, and detail constraints.
Start with small changes to subject, scene, camera, and color, then generate a few variations to compare composition and detail without turning the page copy into keyword stuffing.
Como usar este prompt
- Copy the prompt JSON from the page.
- Paste it into Sora 2 or a compatible AI image generator that accepts structured inputs.
- Customize the argument values (e.g., main headline, axis labels, callout text) by editing the JSON fields.
- Generate the infographic — the AI will create a dual-axis line chart with the specified style and data.
- Review the output, tweak arguments if needed, and regenerate for your final visual.