GPT Image 2AI 提示词
Dual-Axis Crime Data Infographic Prompt
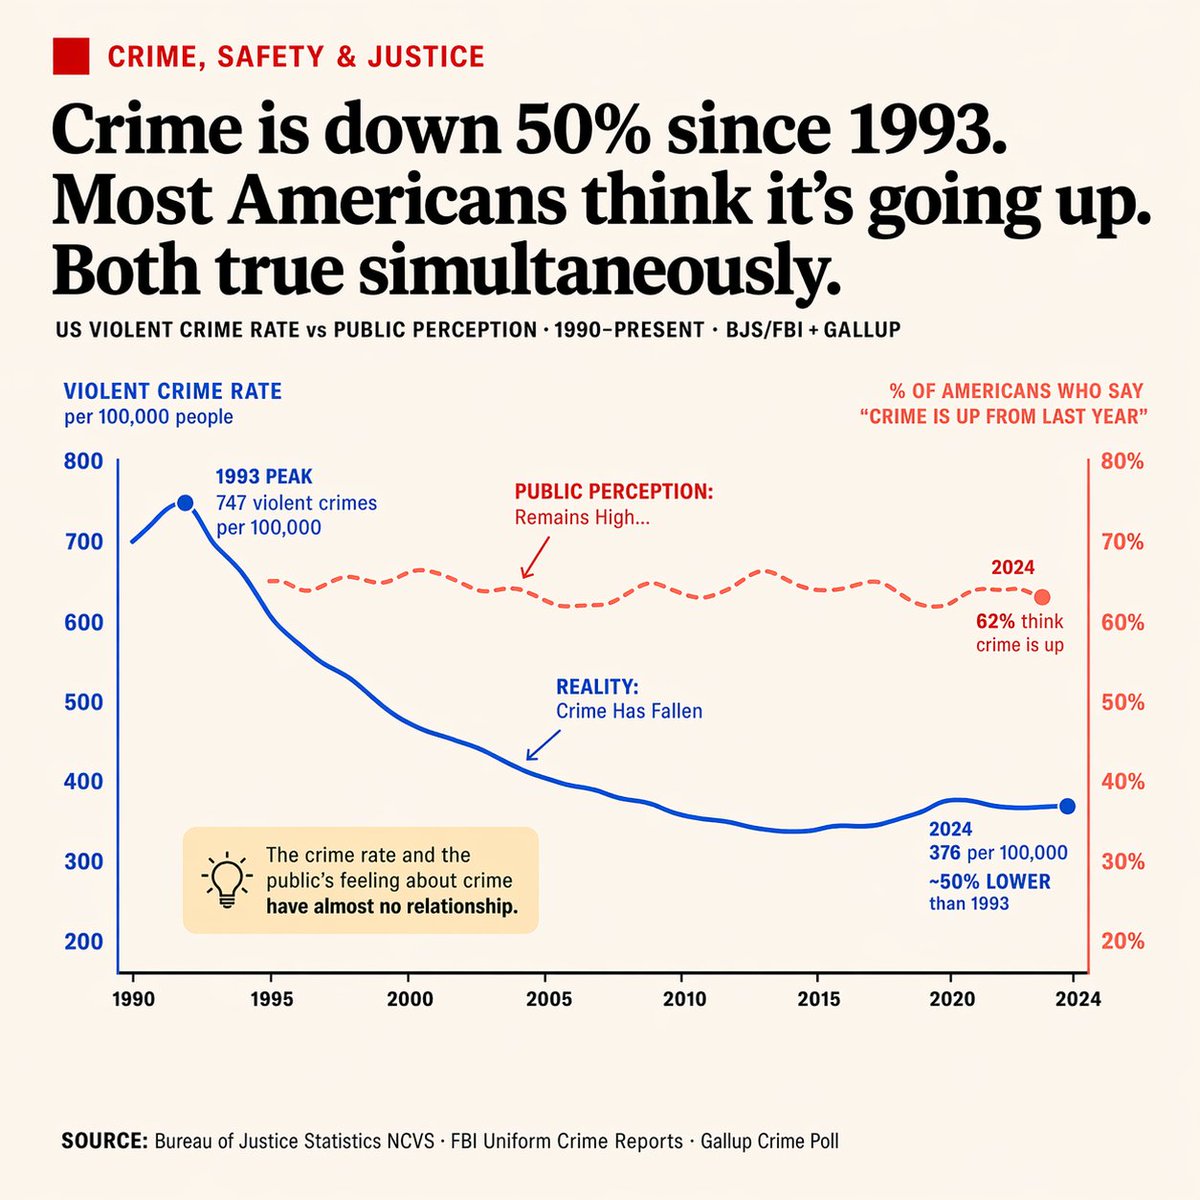
Generate a clean, newspaper-style chart contrasting US violent crime rates with public perception. Includes annotations, a callout box, and customizable data points.
提示词 · EN
type
editorial infographic dual-axis line chartstyle
clean, newspaper-style, off-white background, highly legible typographyheader
category
CRIME, SAFETY & JUSTICE (red text with red square icon)headline
{argument name="main headline" default="Crime is down 50% since 1993. Most Americans think it's going up. Both true simultaneously."}sub_headline
US VIOLENT CRIME RATE vs PUBLIC PERCEPTION · 1990-PRESENT · BJS/FBI + GALLUPchart
x_axis
Years 1990 to 2024 with 8 tick marksleft_y_axis
color
bluelabel
{argument name="left axis label" default="VIOLENT CRIME RATE per 100,000 people"}range
200 to 800right_y_axis
color
redlabel
{argument name="right axis label" default="% OF AMERICANS WHO SAY 'CRIME IS UP FROM LAST YEAR'"}range
20% to 80%data_series
item 1
name
Realitystyle
solid blue linetrend
peaks early then drops significantlyannotations
item 1
1993 PEAK 747 violent crimes per 100,000 (with blue dot)item 2
REALITY: Crime Has Fallen (with blue arrow pointing to line)item 3
2024 376 per 100,000 ~50% LOWER than 1993 (with blue dot)item 2
name
Public Perceptionstyle
dashed red linetrend
remains relatively flat and highannotations
item 1
PUBLIC PERCEPTION: Remains High... (with red arrow pointing to line)item 2
2024 62% think crime is up (with red dot)callout_box
position
bottom left inside chart areastyle
light yellow rectangleicon
lightbulbtext
{argument name="callout text" default="The crime rate and the public's feeling about crime have almost no relationship."}footer
text
SOURCE: {argument name="footer source" default="Bureau of Justice Statistics NCVS · FBI Uniform Crime Reports · Gallup Crime Poll"}关于这个提示词
Generate a clean, newspaper-style chart contrasting US violent crime rates with public perception. Includes annotations, a callout box, and customizable data points. 它更适合作为 GPT Image 2 的概念艺术起点:先保留画面结构、主体关系和风格约束,再替换成你的品牌、人物或场景。
这条提示词使用结构化 JSON 组织信息,包含 type、style、header、chart、callout box、footer 等字段。保留这种层级能让模型更清楚地区分画面主题、布局、界面元素和细节约束。
使用时建议先小幅修改主体、场景、镜头和色调,再生成多个版本对比构图与细节。这样页面内容对用户有实际帮助,也避免把模型名或标签机械堆在正文里。
如何使用这个提示词
- Copy the prompt JSON. 2. Choose a visual AI model (e.g., Sora 2, Midjourney). 3. Edit the 'argument' variables for a custom headline or axis labels. 4. Generate the image for a publication-ready infographic.