GPT Image 2AI 提示词
Dual-Axis Crime Data Chart — Editorial Infographic Prompt
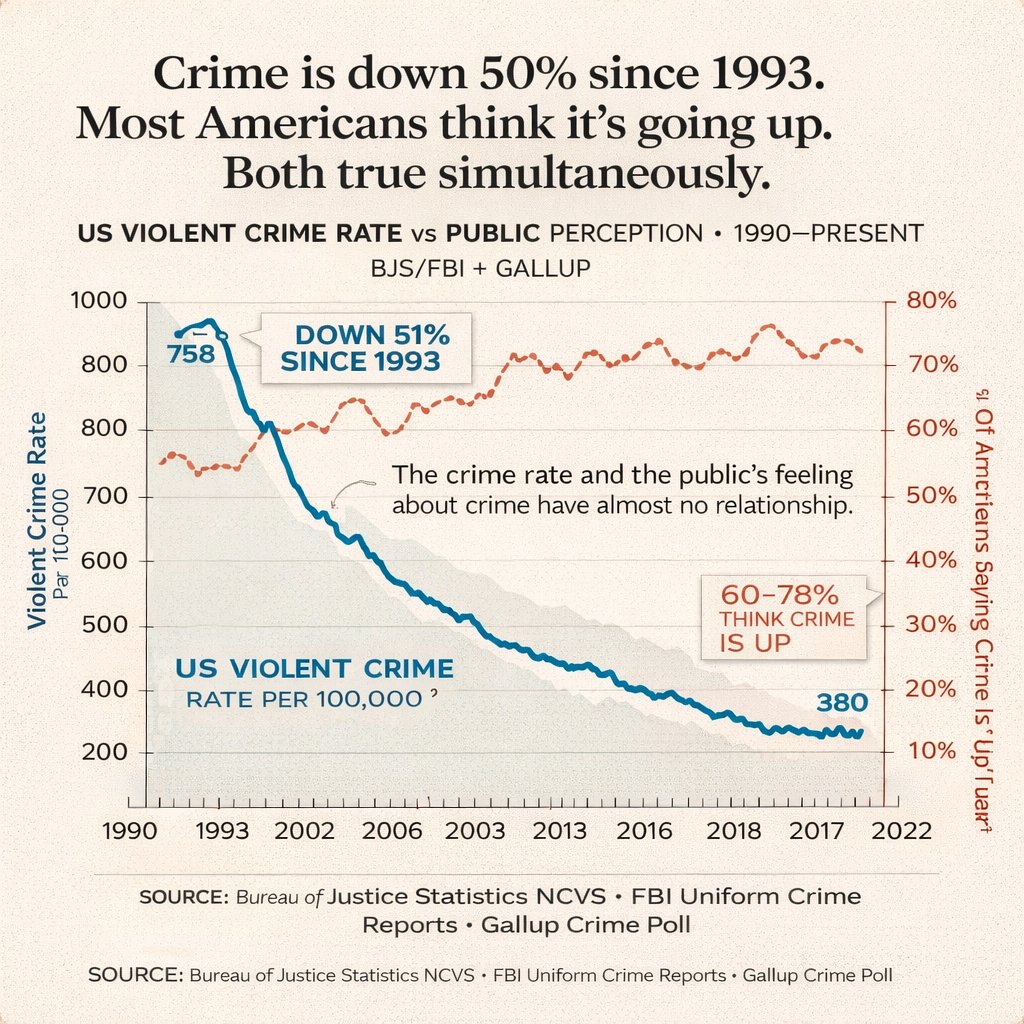
Creates a journalistic line chart comparing actual US crime rates with public perception, complete with headlines and data callouts.
提示词 · EN
type
dual-axis line chart infographicstyle
editorial data visualization, matte paper texture background, clean journalistic designtypography
headline
serif font, bold, centeredlabels
sans-serif, clean, uppercase and sentence case mixlayout
header
main_title
{argument name="main headline" default="Crime is down 50% since 1993. Most Americans think it's going up. Both true simultaneously."}subtitle
US VIOLENT CRIME RATE vs PUBLIC PERCEPTION • 1990–PRESENT BJS/FBI + GALLUPchart_area
background
light beige with faint horizontal grid linesaxes
x_axis
label
Yearsticks
item 1
1990item 2
1993item 3
2002item 4
2006item 5
2003item 6
2013item 7
2016item 8
2018item 9
2017item 10
2022y_axis_left
label
{argument name="left axis label" default="Violent Crime Rate Par 100-000"}scale
item 1
200item 2
400item 3
500item 4
600item 5
700item 6
800item 7
800item 8
1000color
blacky_axis_right
label
{argument name="right axis label" default="% Of Americans Saying Crime Is 'Up'"}scale
item 1
10%item 2
20%item 3
30%item 4
40%item 5
50%item 6
60%item 7
70%item 8
80%color
dark reddata_series
item 1
name
Violent Crime Ratestyle
thick solid blue line with light grey shading underneathtrend
starts high, drops sharply, then steadily declinesdata_labels
item 1
758item 2
380item 2
name
Public Perceptionstyle
dashed dark red/orange line with small circle markerstrend
fluctuates but generally trends upwards, staying highannotations
item 1
text
{argument name="blue line annotation" default="DOWN 51% SINCE 1993"}style
callout box with pointer, blue textposition
top left, pointing to the blue line dropitem 2
text
60-78% THINK CRIME IS UPstyle
callout box with pointer, red textposition
mid right, pointing to the dashed red lineitem 3
text
{argument name="center insight text" default="The crime rate and the public's feeling about crime have almost no relationship."}style
floating text with a small squiggly arrowposition
center, between the two linesfooter
source_text
SOURCE: Bureau of Justice Statistics NCVS • FBI Uniform Crime Reports • Gallup Crime Pollrepetition
text is repeated twice at the bottom关于这个提示词
Creates a journalistic line chart comparing actual US crime rates with public perception, complete with headlines and data callouts. 它更适合作为 GPT Image 2 的概念艺术起点:先保留画面结构、主体关系和风格约束,再替换成你的品牌、人物或场景。
这条提示词使用结构化 JSON 组织信息,包含 type、style、typography、layout 等字段。保留这种层级能让模型更清楚地区分画面主题、布局、界面元素和细节约束。
使用时建议先小幅修改主体、场景、镜头和色调,再生成多个版本对比构图与细节。这样页面内容对用户有实际帮助,也避免把模型名或标签机械堆在正文里。
如何使用这个提示词
- Copy the full prompt from the page.
- Paste it into an AI model that supports JSON/structured prompts (like Sora 2).
- Customize the headline, axis labels, or data arguments to fit your dataset.
- Generate the image and refine if needed by adjusting style keywords.