GPT Image 2AI 提示词
Cyberpunk Neon HUD — M5Stack Usage Dashboard Prompt
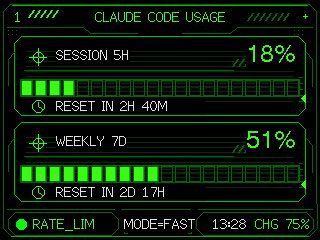
Turns a basic usage gauge into a polished neon-green cyberpunk terminal dashboard for tiny 320×240 embedded displays.
提示词 · EN
Using the provided reference image as the functional UI base, redesign it into a polished neon-green cyberpunk terminal interface suitable for an M5Stack-style 320×240 display. Keep the same two usage meters and overall information hierarchy, but replace the plain black layout with thin glowing vector line art, angular framed panels, pixel/monospace typography, and sci-fi HUD decorations. Convert the two meters into 2 stacked framed cards: 1) “SESSION 5H” with a crosshair icon, large percentage “argsession percent: 18%”, a segmented horizontal progress bar, and a clock/reset row reading “argsession reset text: RESET IN 2H 40M”; 2) “WEEKLY 7D” with a crosshair icon, large percentage “argweekly percent: 51%”, a segmented horizontal progress bar, and a clock/reset row reading “argweekly reset text: RESET IN 2D 17H”. Add a top header reading “argheader text: CLAUDE CODE USAGE” centered, with decorative diagonal tick marks on both sides and a small plus sign at the top right. Add a bottom status bar with exactly 5 visible items: a green status dot, “RATE_LIM”, “MODE=FAST”, “13:28”, and “CHG 75%”. Use only black background, bright green strokes, darker green grid/bar outlines, and crisp pixel-perfect rendering; make the final image look like a refined embedded-device dashboard rather than a flat mockup.
关于这个提示词
Turns a basic usage gauge into a polished neon-green cyberpunk terminal dashboard for tiny 320×240 embedded displays. 它更适合作为 GPT Image 2 的概念艺术起点:先保留画面结构、主体关系和风格约束,再替换成你的品牌、人物或场景。
使用时优先替换 session percent、session reset text、weekly percent、weekly reset text 等占位符,并保持镜头、构图和材质描述的顺序不变。这样更容易获得稳定的画面结果,也方便继续做多版本对比。
如何使用这个提示词
- Copy the full prompt above into your preferred AI image generator.
- Choose a model that supports detailed vector-style rendering (e.g., Sora 2, DALL·E 3).
- Adjust the template variables (
session percent,weekly percent, reset times, header text) to match your own data. - Submit the prompt and review the generated dashboard image.
- Iterate by tweaking colors or layout keywords until the HUD looks pixel-perfect on your target device.