GPT Image 2AI 提示词
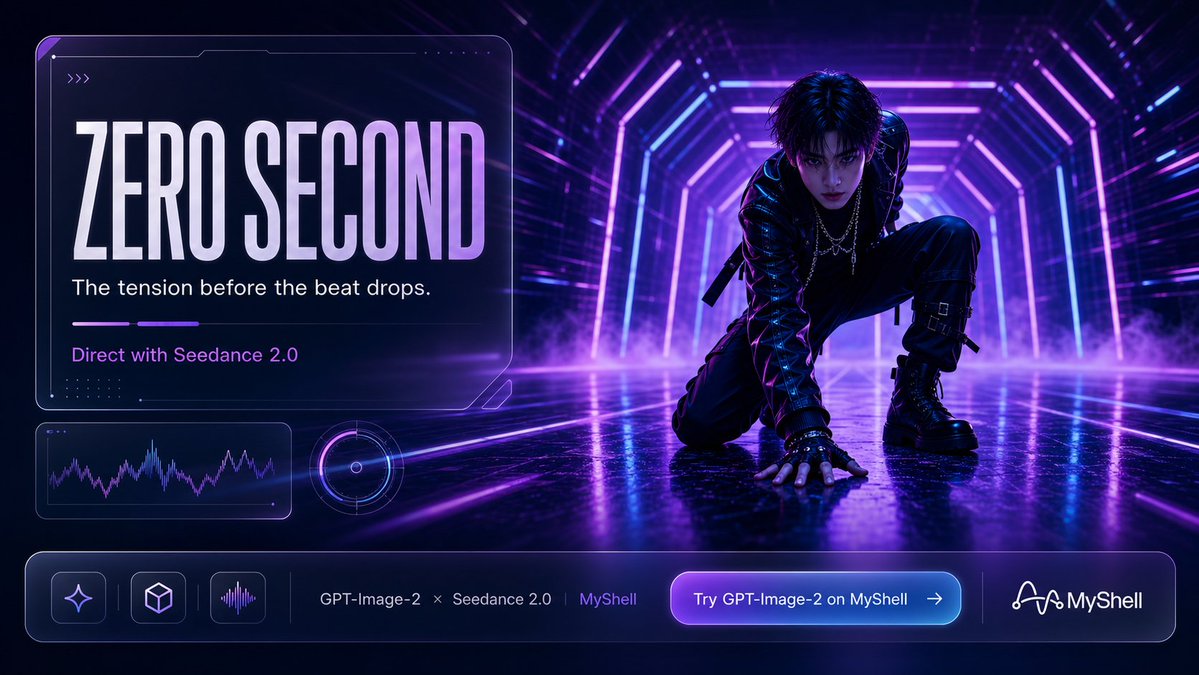
Glowing Neon HUD: Enterprise Enablement System Infographic
Generate a futuristic, dark-mode enterprise enablement infographic with glowing HUD nodes, team metrics, and data viz — ideal for tech strategy decks.
提示词 · EN
type
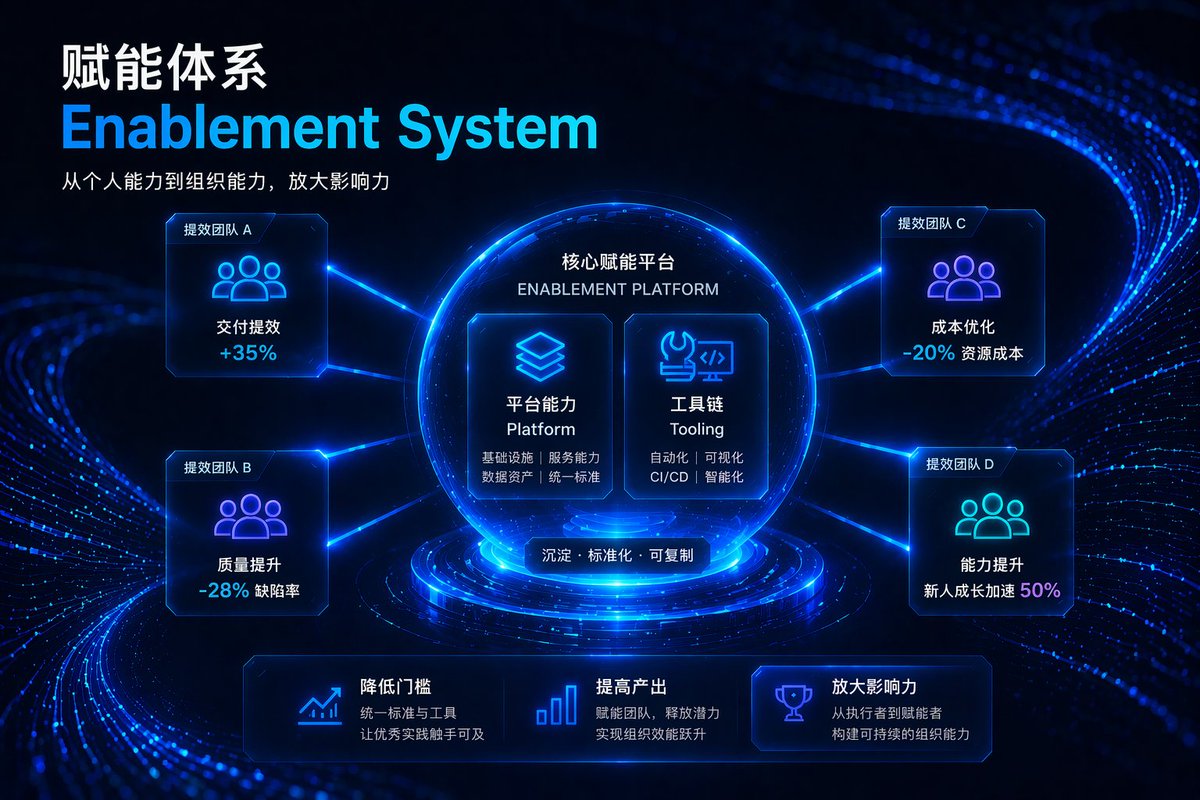
企业演示 Slides 信息图style
深色模式,未来感,高科技 HUD,发光光纤线条,{argument name="theme color" default="霓虹蓝与青色"}header
position
左上角title_chinese
{argument name="main title" default="赋能体系"}title_english
{argument name="english title" default="Enablement System"}subtitle
{argument name="subtitle" default="从个人能力到组织能力,放大影响力"}layout
centerpiece
description
发光球形基座title
{argument name="platform name" default="核心赋能平台"}subtitle
ENABLEMENT PLATFORMinner_cards_count
2inner_cards
item 1
icon
层叠方块title
平台能力 Platformdetails
基础设施 | 服务能力 | 数据资产 | 统一标准item 2
icon
扳手与代码括号title
工具链 Toolingdetails
自动化 | 可视化 | CI/CD | 智能化bottom_label
沉淀 · 标准化 · 可复制surrounding_nodes_count
4surrounding_nodes
item 1
position
左上label
提效团队 Aicon
三人剪影metric
交付提效 +35%item 2
position
左下label
提效团队 Bicon
三人剪影metric
质量提升 -28% 缺陷率item 3
position
右上label
提效团队 Cicon
三人剪影metric
成本优化 -20% 资源成本item 4
position
右下label
提效团队 Dicon
三人剪影metric
能力提升 新人成长加速 50%footer_sections_count
3footer_sections
item 1
icon
折线图title
降低门槛description
统一标准与工具,让优秀实践触手可及item 2
icon
柱状图title
提高产出description
赋能团队,释放潜力,实现组织效能跃升item 3
icon
奖杯title
放大影响力description
从执行者到赋能者,构建可持续的组织能力关于这个提示词
Generate a futuristic, dark-mode enterprise enablement infographic with glowing HUD nodes, team metrics, and data viz — ideal for tech strategy decks. 它更适合作为 GPT Image 2 的概念艺术起点:先保留画面结构、主体关系和风格约束,再替换成你的品牌、人物或场景。
这条提示词使用结构化 JSON 组织信息,包含 type、style、header、layout 等字段。保留这种层级能让模型更清楚地区分画面主题、布局、界面元素和细节约束。
使用时建议先小幅修改主体、场景、镜头和色调,再生成多个版本对比构图与细节。这样页面内容对用户有实际帮助,也避免把模型名或标签机械堆在正文里。
如何使用这个提示词
- Copy the prompt provided above.
- Choose an AI image generator like Midjourney, DALL·E 3, or Stable Diffusion.
- Paste the prompt and customize the {argument} variables (e.g., main title, theme color) to match your content.
- Generate the image. If needed, tweak variables or add style modifiers for better results.
- Download and insert the infographic into your presentation or report.