GPT Image 2AI 提示词
Fictional Academic Chart: Oil vs Shark Attacks — Sora 2 Prompt
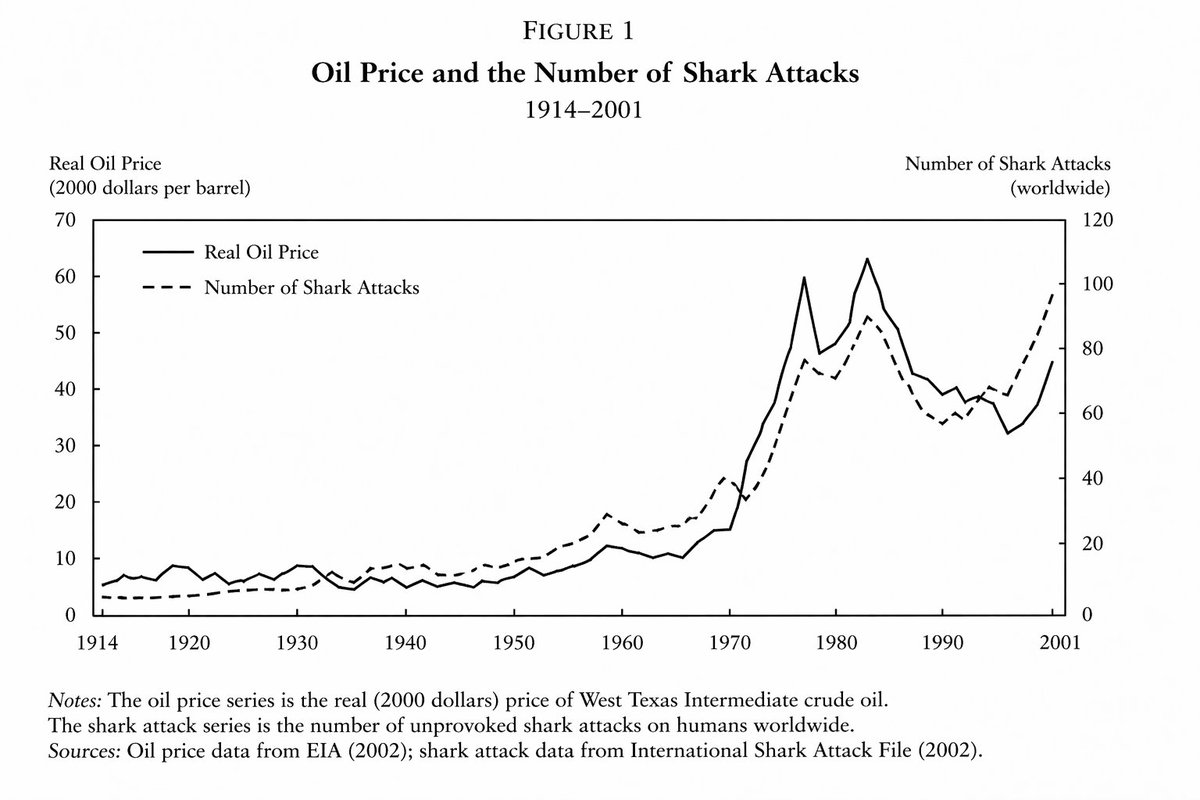
Generate a highly realistic yet fictional economics line chart showing the imperfect correlation between oil prices and shark attacks, perfect for mock data and presentations.
提示词 · EN
来自一份重要且权威的 argfield: 经济学论文 的折线图,展示了 argtime period: 1914 年至 2001 年间 argvariable one: 油价 与 argvariable two: 鲨鱼袭击次数 之间存在紧密但不完全一致的关系
关于这个提示词
Generate a highly realistic yet fictional economics line chart showing the imperfect correlation between oil prices and shark attacks, perfect for mock data and presentations. 它更适合作为 GPT Image 2 的概念艺术起点:先保留画面结构、主体关系和风格约束,再替换成你的品牌、人物或场景。
使用时优先替换 field、time period、variable one、variable two 等占位符,并保持镜头、构图和材质描述的顺序不变。这样更容易获得稳定的画面结果,也方便继续做多版本对比。
如何使用这个提示词
- Copy the prompt from this page.
- Paste it into your preferred AI image generator (e.g., DALL·E, Midjourney, Stable Diffusion).
- Customize the variables (field, time period, variable one, variable two) to fit your desired scenario.
- Generate the image and download your fictional academic chart.