GPT Image 2AI 提示词
Generate a 3rd Order Hilbert Curve Infographic — Sora 2 Prompt
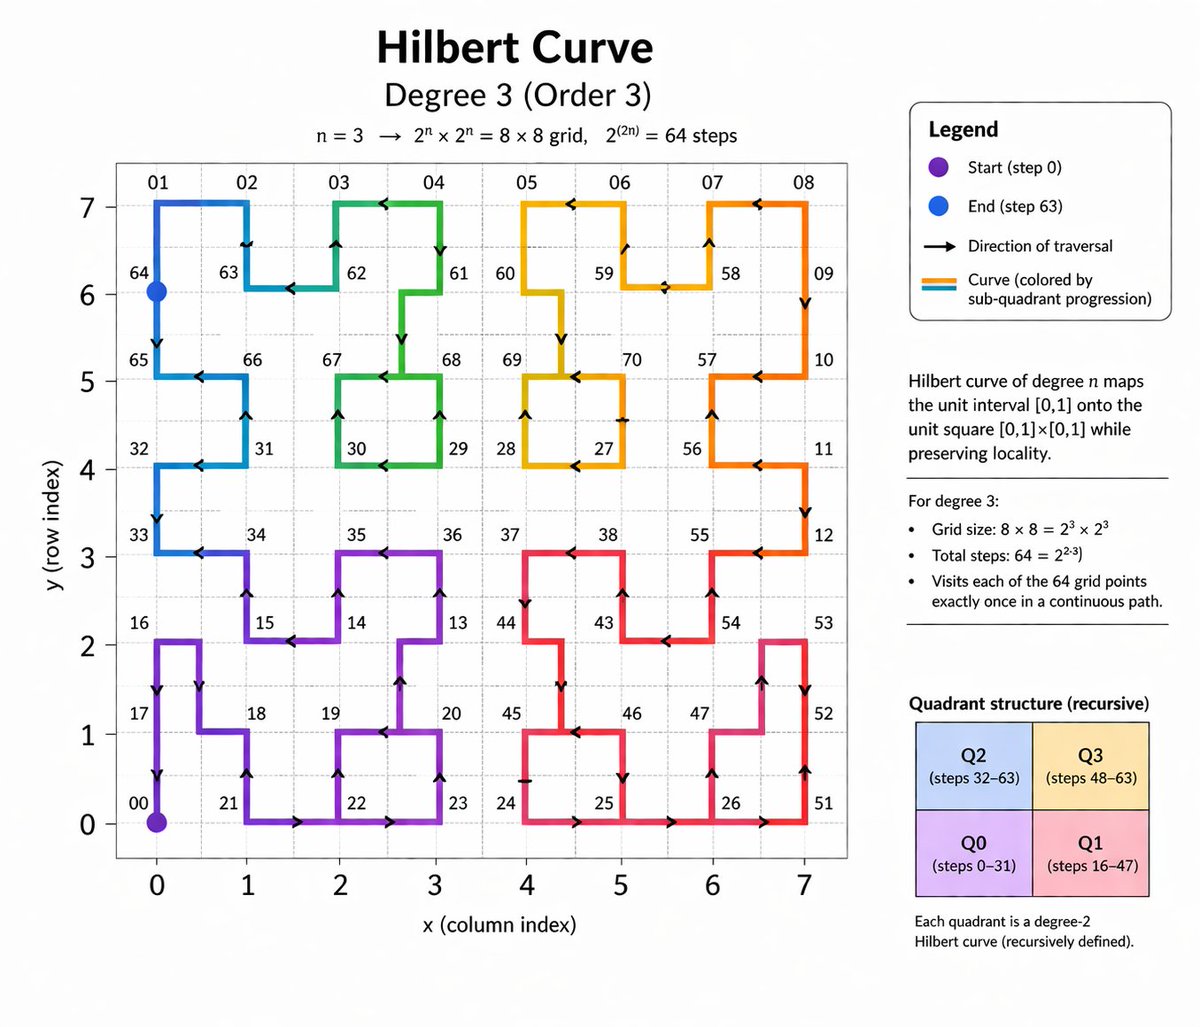
Create a detailed educational math infographic explaining Hilbert curves, complete with labeled 8x8 grid, color-coded path, legend, definitions, and recursive structure.
提示词 · EN
type
教育性数学信息图header
title
{argument name="main title" default="希尔伯特曲线"}subtitle
{argument name="degree subtitle" default="3 阶 (Order 3)"}equation
n = 3 -> 2^n x 2^n = 8 x 8 网格,2^(2n) = 64 个步骤layout
left_panel
大型二维线图right_sidebar
堆叠的信息面板和文本块main_graph
axes
x_axis
标注为 'x (列索引)',刻度为 0 到 7y_axis
标注为 'y (行索引)',刻度为 0 到 7grid
{argument name="grid size" default="8x8"} 虚线浅灰色网格curve
description
填充网格的连续不相交路径style
带有方向箭头的粗线colors
{argument name="curve colors" default="从紫色、蓝色、绿色、黄色、橙色到红色的渐变色"}markers
item 1
左下角的紫色点,标注为 '00'item 2
左上角的蓝色点,标注为 '64'labels
沿路径顶点散布的各种两位数,例如 01、02、32、65、70sidebar
sections
item 1
title
图例type
圆角框count
4items
item 1
紫色点:'起点 (步骤 0)'item 2
蓝色点:'终点 (步骤 63)'item 3
黑色箭头:'遍历方向'item 4
彩色线条:'曲线 (按子象限进度着色)'item 2
title
定义type
文本块text
n 阶希尔伯特曲线将单位区间 [0,1] 映射到单位正方形 [0,1]x[0,1],同时保持局部性。item 3
title
属性type
项目符号列表heading
对于 3 阶:count
3items
item 1
网格大小:8 x 8 = 2^3 x 2^3item 2
总步骤数:64 = 2^{2*3}item 3
以连续路径精确访问每个 64 个网格点一次。item 4
title
象限结构 (递归)type
2x2 彩色网格count
4boxes
item 1
左上蓝色:'Q2 (步骤 32-63)'item 2
右上黄色:'Q3 (步骤 48-63)'item 3
左下紫色:'Q0 (步骤 0-31)'item 4
右下粉色:'Q1 (步骤 16-47)'footer_text
每个象限都是一个 2 阶希尔伯特曲线 (递归定义)。关于这个提示词
Create a detailed educational math infographic explaining Hilbert curves, complete with labeled 8x8 grid, color-coded path, legend, definitions, and recursive structure. 它更适合作为 GPT Image 2 的概念艺术起点:先保留画面结构、主体关系和风格约束,再替换成你的品牌、人物或场景。
这条提示词使用结构化 JSON 组织信息,包含 type、header、layout、main graph、sidebar 等字段。保留这种层级能让模型更清楚地区分画面主题、布局、界面元素和细节约束。
使用时建议先小幅修改主体、场景、镜头和色调,再生成多个版本对比构图与细节。这样页面内容对用户有实际帮助,也避免把模型名或标签机械堆在正文里。
如何使用这个提示词
- Copy the prompt from this page.
- Open your AI image generation tool (e.g., Sora, DALL·E).
- Adjust the customizable variables like main title, subtitle, grid size, and color gradient to suit your needs.
- Paste the prompt and generate the infographic.
- Refine the output by tweaking variables or regenerating if needed.