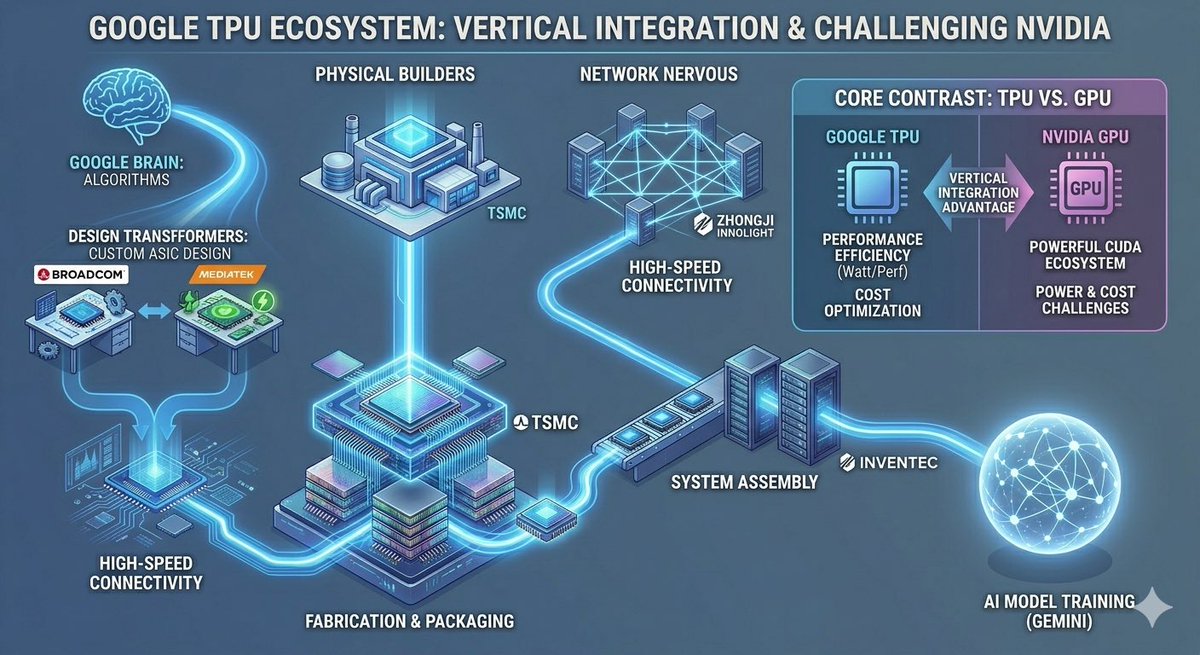
Google TPU Ecosystem Infographic — Neon Tech Supply Chain Map
Generates a stunning wide neon-blue tech infographic mapping the Google TPU supply chain and comparing its vertical integration advantages against Nvidia GPUs for industry analysis.
À propos de ce prompt
Generates a stunning wide neon-blue tech infographic mapping the Google TPU supply chain and comparing its vertical integration advantages against Nvidia GPUs for industry analysis. Use it as a Art Conceptuel starting point for GPT Image 2: keep the visual structure and style constraints intact, then swap in your own subject, brand, or scene.
This prompt is organized as structured JSON with fields such as type, title, style, layout, comparison panel, visual elements, and customization. Keeping that hierarchy helps the model separate the subject, layout, interface elements, and detail constraints.
Start with small changes to subject, scene, camera, and color, then generate a few variations to compare composition and detail without turning the page copy into keyword stuffing.
Comment utiliser ce prompt
- Copy the entire prompt JSON block into your chosen AI image generation model.
- Select a model proficient in complex diagrams and tech illustrations (e.g., Sora 2, DALL-E 3, or Midjourney).
- Customize the
headline textvariable to change the main title of the infographic. - Adjust the
styleorlayoutdetails (like colors or specific section visuals) if you need a different aesthetic. - Generate the image, reviewing the output for clarity of labels and correct flow from left to right.