Hilbert Curve Mathematical Infographic Generator
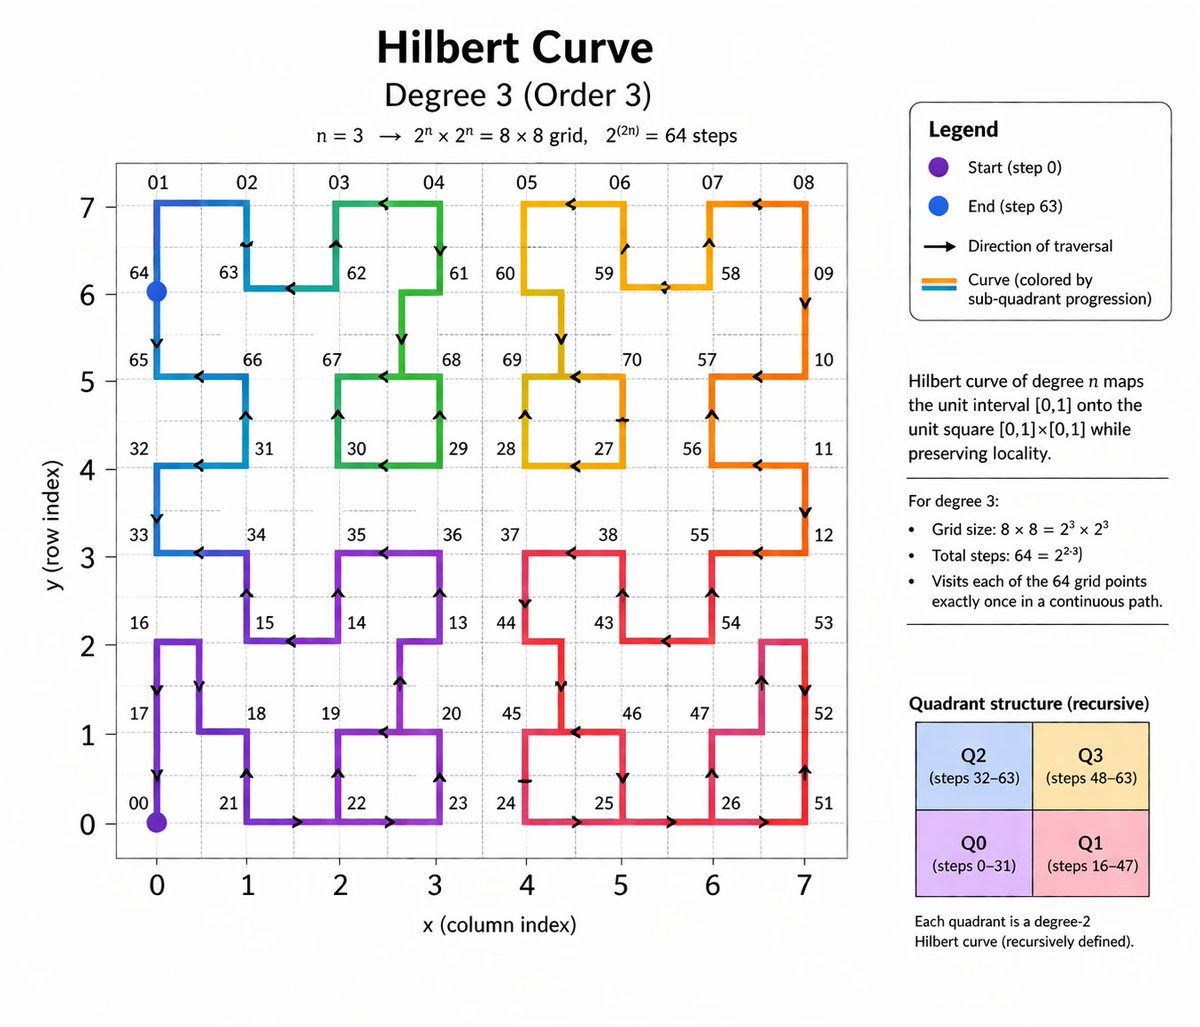
Generate a detailed educational diagram of a degree 3 Hilbert curve with a color-coded path, labeled grid, and explanatory legend sidebar.
À propos de ce prompt
Generate a detailed educational diagram of a degree 3 Hilbert curve with a color-coded path, labeled grid, and explanatory legend sidebar. Use it as a Art Conceptuel starting point for GPT Image 2: keep the visual structure and style constraints intact, then swap in your own subject, brand, or scene.
This prompt is organized as structured JSON with fields such as type, header, layout, main graph, and sidebar. Keeping that hierarchy helps the model separate the subject, layout, interface elements, and detail constraints.
Start with small changes to subject, scene, camera, and color, then generate a few variations to compare composition and detail without turning the page copy into keyword stuffing.
Comment utiliser ce prompt
- Copy the prompt code block.
- Choose an AI model that excels at detailed 2D illustration and text rendering.
- Adjust variables like
main title,degree subtitle, orcurve colorsin the arguments to customize the output. - Generate the image for a precise, publication-ready mathematical infographic.