GPT Image 2Prompt IA
Retro Neon Terminal Dashboard — Sora 2 Prompt
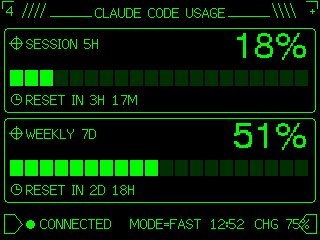
Generate a pixel-perfect CRT-green terminal UI gauge for Claude Code usage, styled for embedded M5Stack displays.
PROMPT · EN
Using REFERENCE_0 as the functional layout and data source, redesign it as a polished monochrome neon-green retro terminal UI for an M5Stack-style low-resolution display. Keep the same concept of a Claude Code usage gauge with 2 usage panels: SESSION 5H and WEEKLY 7D. Convert the plain progress bars into segmented pixel bars with 24 rectangular blocks each, preserve the approximate usage values but update the visible numbers to argsession percentage: 18% and argweekly percentage: 51%. Add thin glowing green borders around each panel, pixel/bitmap typography, small target/crosshair icons beside the panel titles, and clock icons beside the reset lines. Replace the simple title with a decorative header reading argheadline text: CLAUDE CODE USAGE, flanked by terminal-like slashes and line ornaments. At the bottom, add a retro status row with a flag/terminal outline icon, green connection dot, argconnection label: CONNECTED, MODE=FAST, argtime: 12:52, and CHG 75% with a small battery/charging icon. Use a black background, bright CRT green lines, crisp pixel art styling, and make the result look like a refined embedded-device dashboard rather than a flat chart.
À propos de ce prompt
Generate a pixel-perfect CRT-green terminal UI gauge for Claude Code usage, styled for embedded M5Stack displays. Use it as a Art Conceptuel starting point for GPT Image 2: keep the visual structure and style constraints intact, then swap in your own subject, brand, or scene.
Start by replacing session percentage, weekly percentage, headline text, and connection label, then keep the camera, composition, and material cues in the same order. This makes the output easier to compare across variations.
Comment utiliser ce prompt
- Copy the prompt below into your preferred AI image generator like Sora 2 or DALL-E.
- Optionally tweak the
{argument}placeholders (e.g., session percentage, weekly percentage) to match your data. - Select a model that supports detailed UI and pixel art generation.
- Generate the image and review the retro dashboard output.
- Adjust values or regenerate as needed for your specific display project.