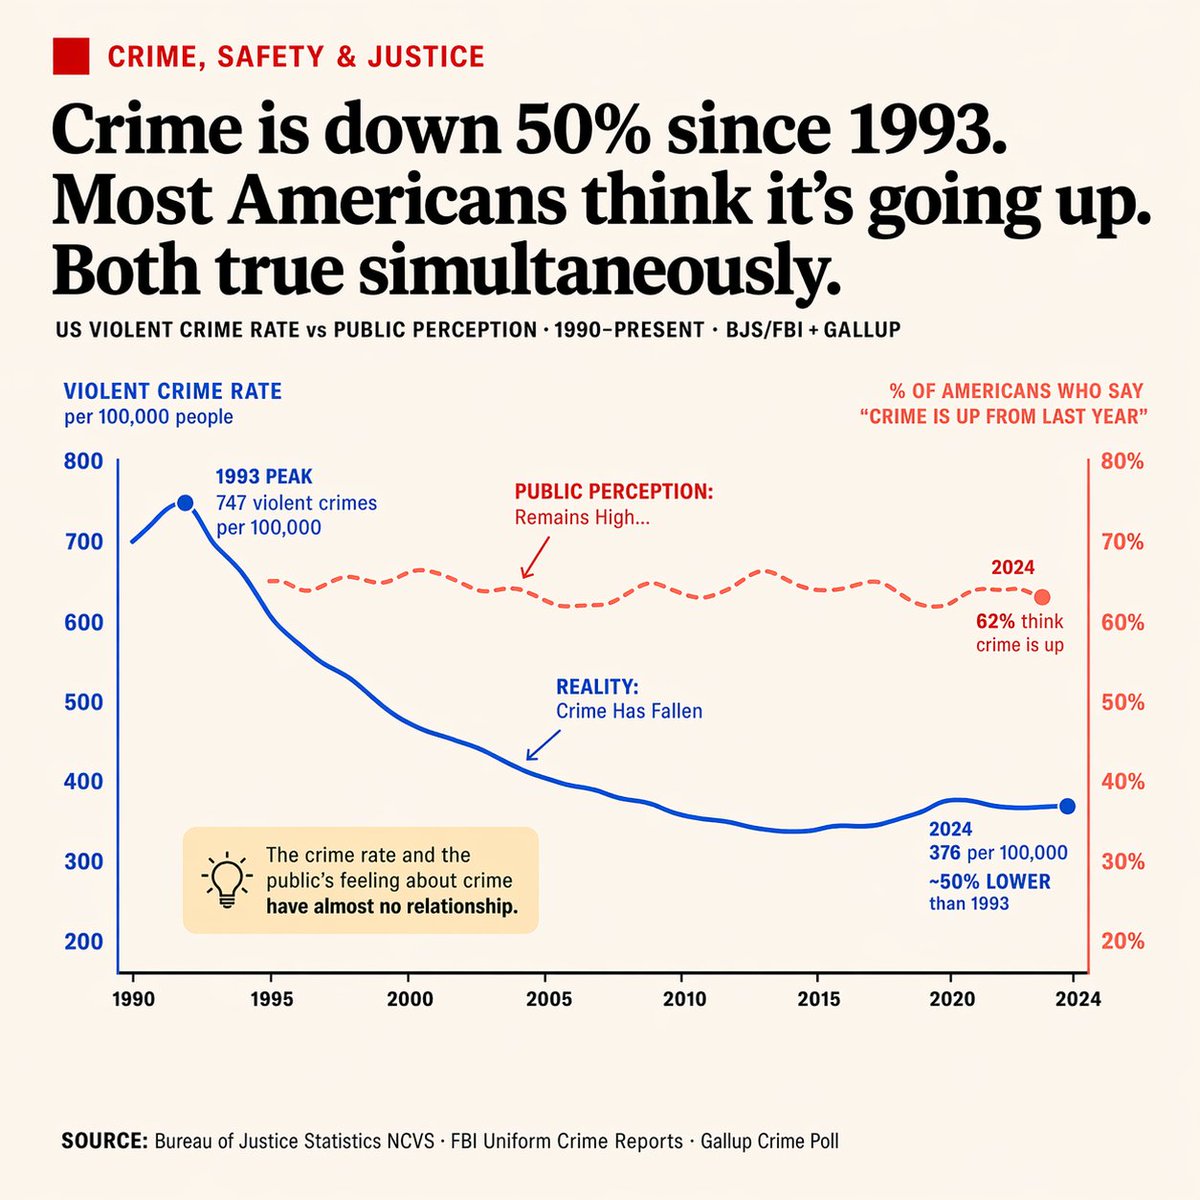
Dual-Axis Crime Data Infographic Prompt
Generate a clean, newspaper-style chart contrasting US violent crime rates with public perception. Includes annotations, a callout box, and customizable data points.
このプロンプトについて
Generate a clean, newspaper-style chart contrasting US violent crime rates with public perception. Includes annotations, a callout box, and customizable data points. Use it as a コンセプトアート starting point for GPT Image 2: keep the visual structure and style constraints intact, then swap in your own subject, brand, or scene.
This prompt is organized as structured JSON with fields such as type, style, header, chart, callout box, and footer. Keeping that hierarchy helps the model separate the subject, layout, interface elements, and detail constraints.
Start with small changes to subject, scene, camera, and color, then generate a few variations to compare composition and detail without turning the page copy into keyword stuffing.
このプロンプトの使い方
- Copy the prompt JSON. 2. Choose a visual AI model (e.g., Sora 2, Midjourney). 3. Edit the 'argument' variables for a custom headline or axis labels. 4. Generate the image for a publication-ready infographic.