GPT Image 2AIプロンプト
Web Architecture Explained Infographic — Sora 2 Prompt
Generate a clear, educational infographic that visually explains frontend, backend, database, and SaaS concepts for beginners.
プロンプト · EN
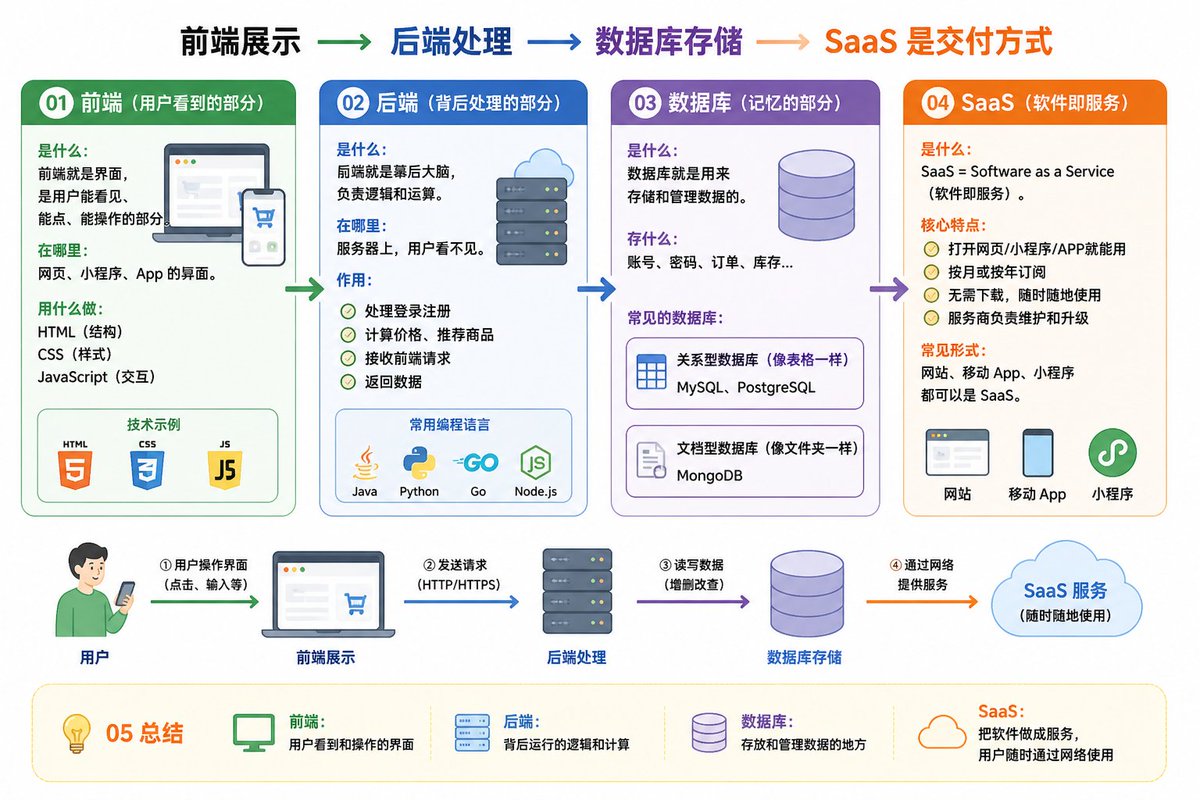
01 前端 (用户可见部分) 定义:用户可以看到、点击并进行交互的界面。
应用场景:网站、小程序和 App 的界面。
工具:HTML (结构)、CSS (样式)、JavaScript (交互)。 02 后端 (幕后的处理部分) 定义:幕后的大脑,负责逻辑和计算。
应用场景:在服务器端,用户不可见。
功能:
处理登录和注册
计算价格并推荐产品
接收前端请求并返回数据
常用语言:Java、Python、Go、JavaScript (Node.js) 03 数据库 (记忆部分) 定义:用于存储和管理数据。
存储内容:账号、密码、订单、库存等。
常用数据库:
MySQL、PostgreSQL (关系型,类似于表格)
MongoDB (文档型,类似于文件夹) 04 SaaS (软件即服务) 定义:SaaS = Software as a Service。
核心特征:
可通过网页、小程序或 App 使用
按月或按年订阅
常见形式:网站、移动端 App 和小程序都可以是 SaaS。 05 总结 前端:用户可见的界面
后端:幕后的逻辑与计算
数据库:数据的存储与管理
SaaS:通过网络交付软件的服务模式
前端展示 → 后端处理 → 数据库存储 → SaaS 交付方式
请根据以上内容帮我绘制一张易于理解的图表。
このプロンプトについて
Generate a clear, educational infographic that visually explains frontend, backend, database, and SaaS concepts for beginners. Use it as a コンセプトアート starting point for GPT Image 2: keep the visual structure and style constraints intact, then swap in your own subject, brand, or scene.
Start with small changes to subject, scene, camera, and color, then generate a few variations to compare composition and detail without turning the page copy into keyword stuffing.
このプロンプトの使い方
- Copy the entire prompt text and paste it into your AI image generator.
- Choose a model optimized for infographic or diagram generation (e.g., Sora 2 or similar).
- You can tweak specific terms like the tech stack examples (e.g., swap MySQL for Redis) to match your focus.
- Generate the image and review the visual layout for clarity and readability.
- Use the output for presentations, blog posts, or educational materials.