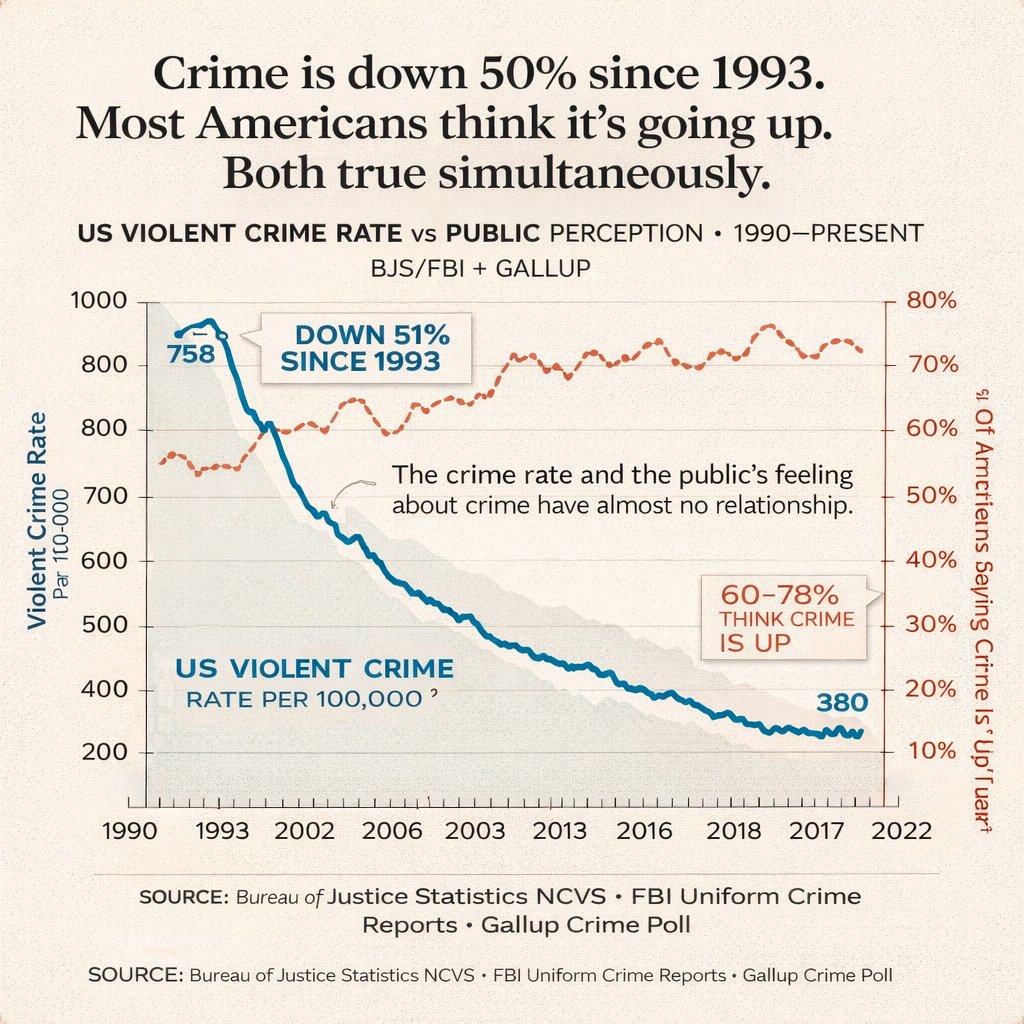
Dual-Axis Chart: Crime Down, Fear Up — AI Prompt
Generate a polished newspaper-style dual-axis chart revealing the stark gap between falling crime rates and rising public fear, in seconds.
このプロンプトについて
Generate a polished newspaper-style dual-axis chart revealing the stark gap between falling crime rates and rising public fear, in seconds. Use it as a コンセプトアート starting point for GPT Image 2: keep the visual structure and style constraints intact, then swap in your own subject, brand, or scene.
This prompt is organized as structured JSON with fields such as type, style, header, chart, and footer. Keeping that hierarchy helps the model separate the subject, layout, interface elements, and detail constraints.
Start with small changes to subject, scene, camera, and color, then generate a few variations to compare composition and detail without turning the page copy into keyword stuffing.
このプロンプトの使い方
- Copy the detailed prompt from this page.
- Paste it into a text-to-image AI model such as Midjourney, DALL·E, or Stable Diffusion.
- Customize any variables (e.g., main title, axis labels, annotations) inside the prompt to match your data.
- Generate the infographic; iterate by tweaking the prompt for style or layout.
- Use the output directly in reports, articles, or presentations.