GPT Image 2AIプロンプト
Math Visualization Infographic Prompt — Elegant & Educational
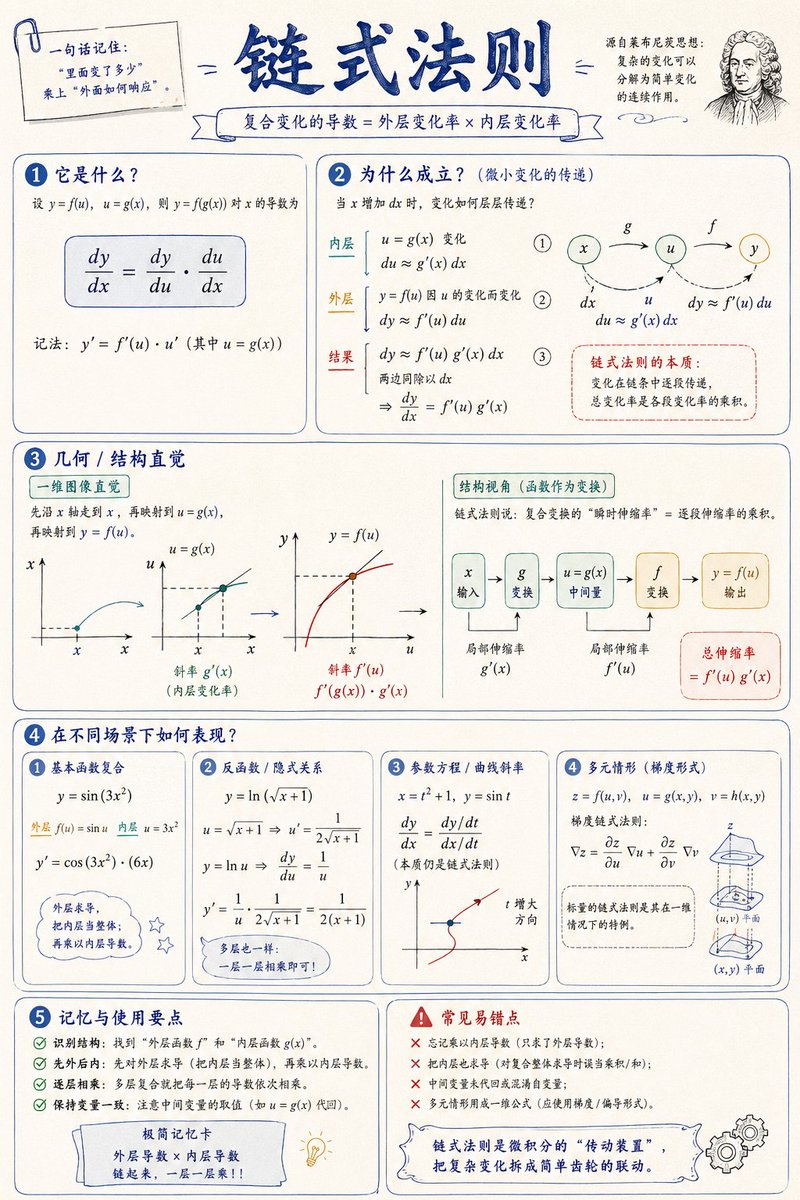
Generates beautiful, hand-drawn style math infographics that visually explain complex concepts with clarity and academic elegance.
1 / 2
プロンプト · EN
请创建一个关于“argtopic: 数学概念/知识点”的数学可视化信息图,帮助读者直观地理解:它是什么、为什么成立、几何/结构直觉,以及它在不同场景下的表现。图片应呈现出高质量数学讲义与手绘教育海报相结合的风格——优雅、清晰、信息丰富且不杂乱。视觉风格:arglayout: 纵向或横向,干净的浅色纸张背景,深蓝色标题,黑色/深灰色正文线条,并点缀少量优雅的蓝色、青色、金色和红色。使用圆角卡片、细边框、编号标签、手绘箭头、局部放大框和总结栏。整体设计应兼具美感、平衡感与学术性,让读者能够一眼掌握该概念背后的“结构”与“逻辑”。
このプロンプトについて
Generates beautiful, hand-drawn style math infographics that visually explain complex concepts with clarity and academic elegance. Use it as a コンセプトアート starting point for GPT Image 2: keep the visual structure and style constraints intact, then swap in your own subject, brand, or scene.
Start by replacing topic and layout, then keep the camera, composition, and material cues in the same order. This makes the output easier to compare across variations.
このプロンプトの使い方
- Copy the prompt template below.
- Choose your preferred AI image generator (e.g., Sora 2, DALL·E, Midjourney).
- Replace the
{topic}variable with your target math concept (e.g., 'Pythagorean theorem'). - Optionally adjust the
{layout}variable to 'portrait' or 'landscape'. - Generate the image and refine with follow-up prompts if needed.